Agent Dashboard
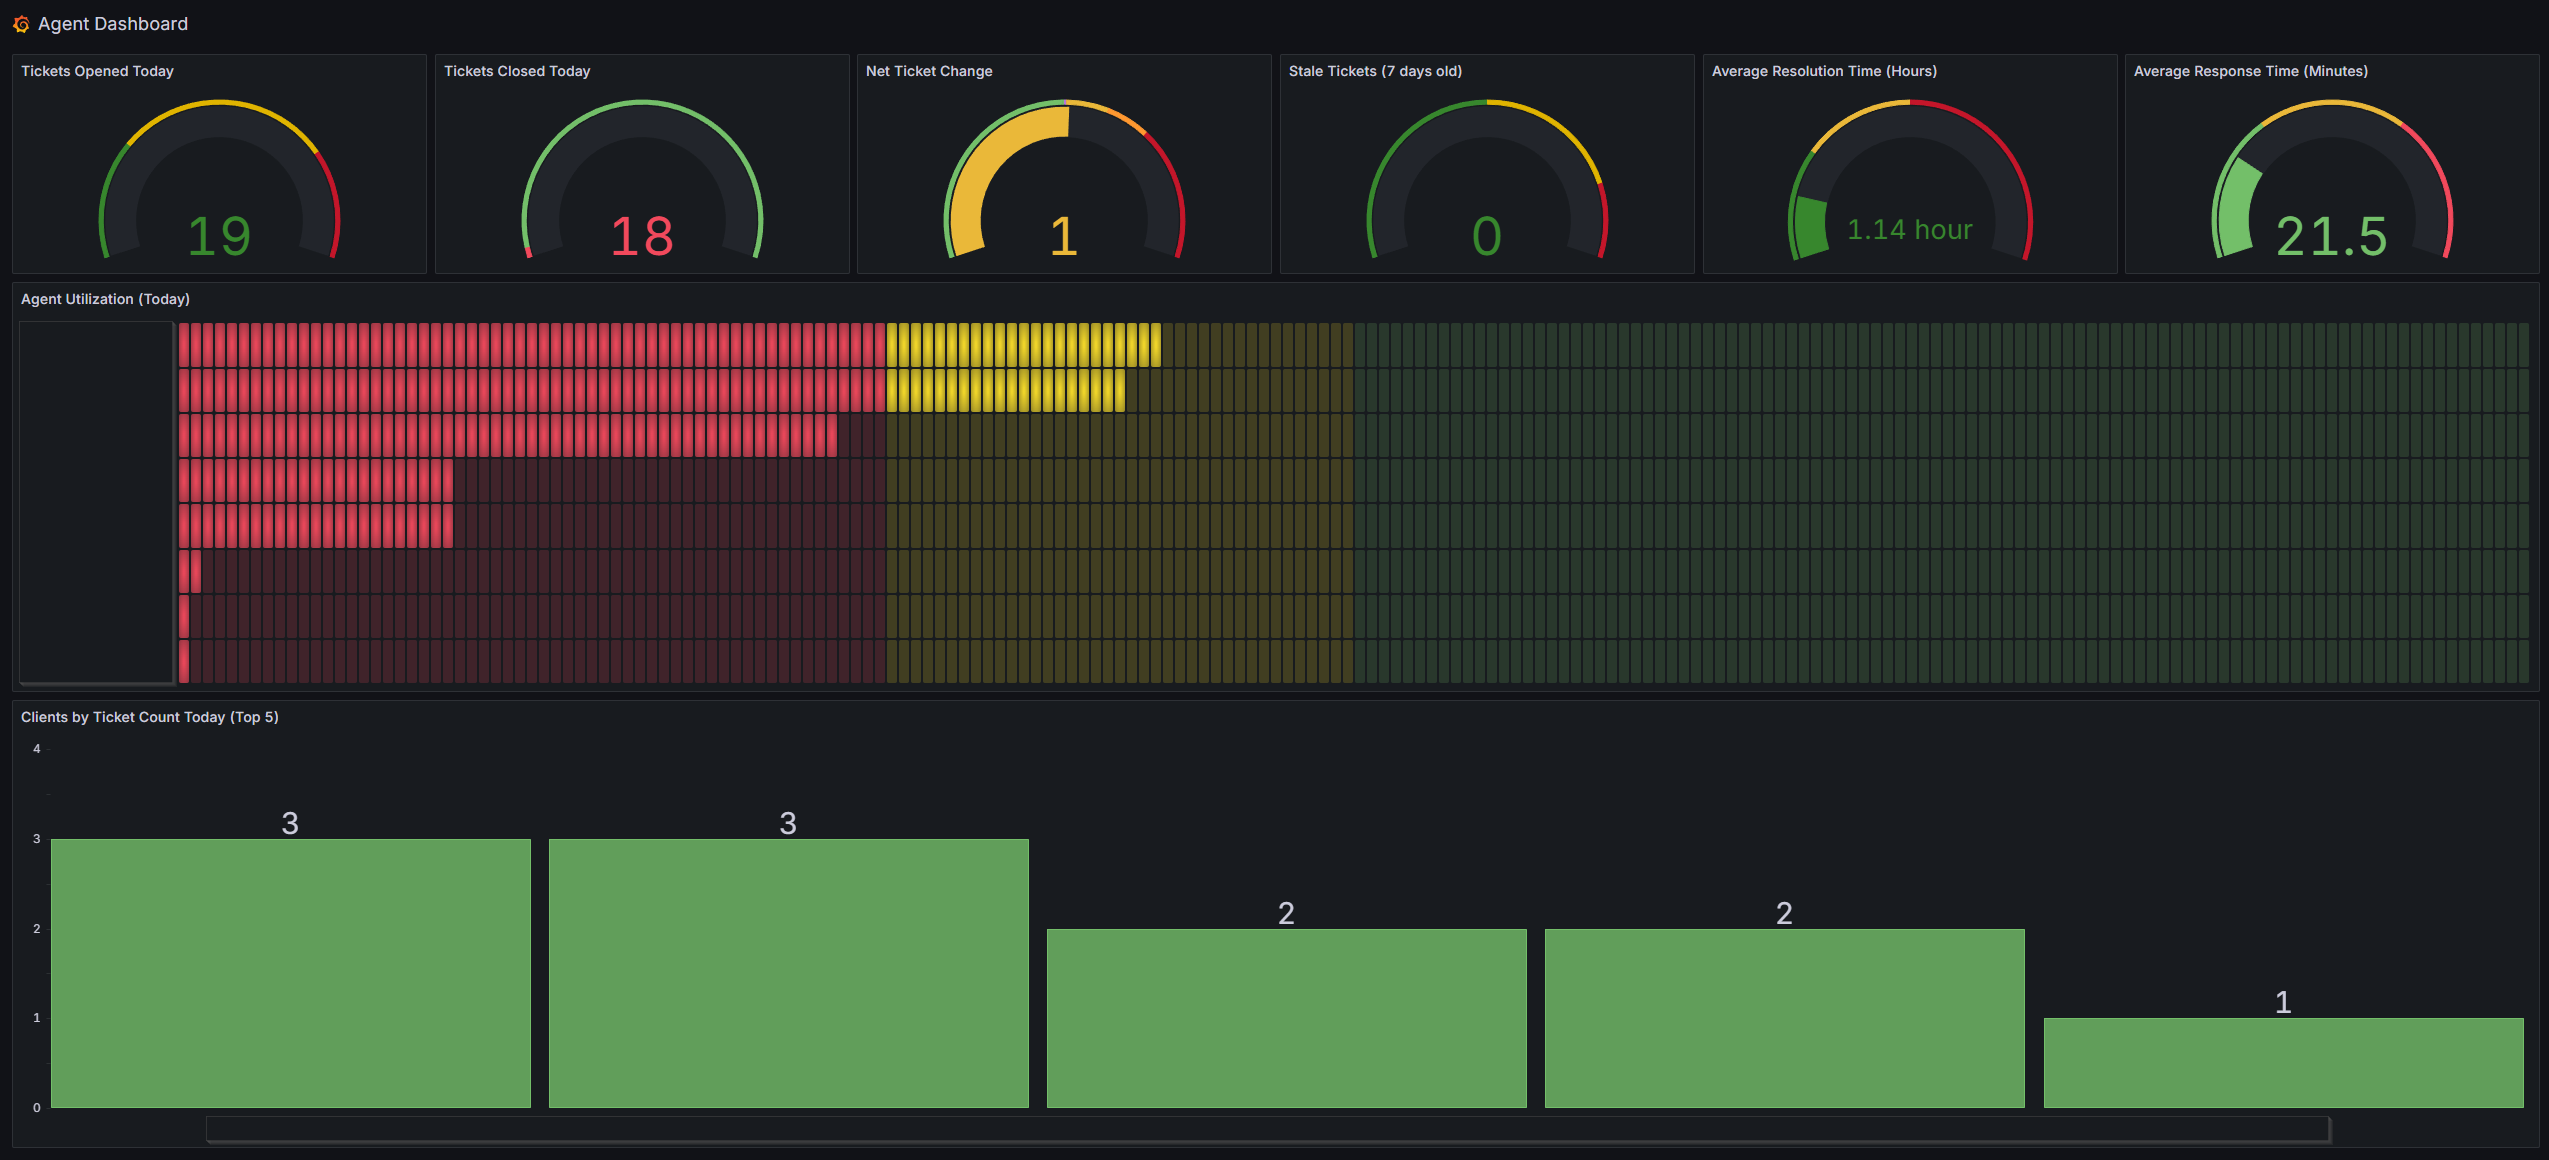
This Grafana dashboard provides comprehensive monitoring and analytics for agent performance, ticket management, and client metrics. The dashboard includes real-time visualizations for ticket volumes, resolution times, agent utilization, and client activity.
Dashboard Components
Panels Included
- Tickets Opened Today - Gauge showing daily ticket volume
- Tickets Closed Today - Gauge tracking closure rates
- Net Ticket Change - Displays the difference between opened and closed tickets
- Stale Tickets - Monitors tickets older than 7 days
- Average Resolution Time - Shows resolution time in hours
- Agent Utilization - Horizontal bar gauge showing daily utilization percentages
- Clients by Ticket Count - Bar chart of top 5 clients by ticket volume
Setup Instructions
Prerequisites
- Grafana instance with Infinity Data Source plugin already installed and configured
- API access to your HaloPSA instance
Creating the Dashboard Manually
- Create New Dashboard:
- Navigate to + > Dashboard
- Click Add visualization
- Select your Infinity data source
Panel 1: Tickets Opened Today (Gauge)
Basic Configuration:
- Panel Title: "Tickets Opened Today"
- Visualization: Gauge
- Position: Top row, first position (h: 6, w: 4, x: 0, y: 0)
Query Configuration:
- URL:
https://your-company.halopsa.com/api/Tickets - Method: GET
- Format: Table
- Parser: Backend
- Root Selector:
$.record_count - Query Parameters:
datesearch:datereportedstartdate:${__from:date:YYYY-MM-DD} 00:00:00enddate:${__to:date:YYYY-MM-DD} 23:59:59count:includeclosed=falsetickettype_id:1,3
- URL:
Field Options:
- Max: 60
- Thresholds:
- Green: 0
- Dark Green: 0
- Dark Yellow: 30
- Dark Red: 50
Panel 2: Tickets Closed Today (Gauge)
Basic Configuration:
- Panel Title: "Tickets Closed Today"
- Visualization: Gauge
- Position: Top row, second position (h: 6, w: 4, x: 4, y: 0)
Query Configuration (Query A - Closed):
- URL:
https://your-company.halopsa.com/api/Tickets - Method: GET
- Root Selector:
$.record_count - Query Parameters:
datesearch:dateclosedstartdate:${__from:date:YYYY-MM-DD} 00:00:00enddate:${__to:date:YYYY-MM-DD} 23:59:59tickettype_id:1,3includedclosed:true
- URL:
Add Second Query (Query B - Open):
- Same URL and basic parameters as Query A
- Query Parameters:
datesearch:datereportedincludeclosed:false- (other parameters same as Query A)
Field Options:
- Max: 60
- Thresholds: Red: 0
Panel 3: Net Ticket Change (Gauge)
Basic Configuration:
- Panel Title: "Net Ticket Change"
- Visualization: Gauge
- Position: Top row, third position (h: 6, w: 4, x: 8, y: 0)
Query Configuration (Query A - Open):
- URL:
https://your-company.halopsa.com/api/Tickets - Root Selector:
$ ~> | $ | {"join_key": "data", "count_a": $.record_count} | - Query Parameters:
datesearch:dateoccurredstartdate:${__from:date:YYYY-MM-DD} 00:00:00enddate:${__to:date:YYYY-MM-DD} 23:59:59requesttype_id:1,3includeclosed:falsecount:1000
- URL:
Add Second Query (Query B - Closed):
- Same URL and basic setup
- Root Selector:
$ ~> | $ | {"join_key": "data", "count_b": $.record_count} | - Query Parameters:
datesearch:dateclosedincludeclosed:true- (other parameters same as Query A)
Transformations:
- Join by field:
join_key, mode:outerTabular - Calculate field:
count_a Open - count_b Closed, mode: binary, replace fields: true
- Join by field:
Field Options:
- Min: -50, Max: 50
- Thresholds: Green: 0, Green: -0.5, Purple: 0, Yellow: 0.5, Orange: 10, Dark Red: 20
Panel 4: Stale Tickets (7 days old) (Gauge)
Basic Configuration:
- Panel Title: "Stale Tickets (7 days old)"
- Visualization: Gauge
- Position: Top row, fourth position (h: 6, w: 4, x: 12, y: 0)
Query Configuration:
- URL:
https://your-company.halopsa.com/api/Tickets - Root Selector:
$count(tickets[tickettype_id = 1 or tickettype_id = 3]) - Query Parameters:
includeclosed:0datesearch:datemodifiedcount:1000startdate:1900-01-01 00:00:00enddate:${__from:date:YYYY-MM-DD:subtract(7d)} 23:59:59
- URL:
Field Options:
- Max: 60
- Thresholds: Green: 0, Dark Green: 0, Dark Yellow: 30, Dark Red: 50
Panel 5: Average Resolution Time (Hours) (Gauge)
Basic Configuration:
- Panel Title: "Average Resolution Time (Hours)"
- Visualization: Gauge
- Position: Top row, fifth position (h: 6, w: 4, x: 16, y: 0)
Query Configuration:
URL:
https://your-company.halopsa.com/api/TicketsRoot Selector:
$exists($.tickets) and $count($.tickets) > 0 ? $average($.tickets[dateclosed != null].(($toMillis(dateclosed) - $toMillis(dateoccurred)) / (1000 * 60 * 60))) : 0Query Parameters:
closed_only:truestartdate:${__from:date:MM-DD-YYYY} 08:00:00requesttype:1,3enddate:${__to:date:MM-DD-YYYY} 17:00:00
Note: Update the times here for your hours of operation
Field Options:
- Min: 0, Max: 8
- Unit: hours (h)
- Decimals: 2
- Thresholds: Green: 0, Dark Green: 0, Yellow: 2, Dark Red: 4
Panel 6: Average Response Time (Minutes) (Gauge)
Basic Configuration:
- Panel Title: "Average Response Time (Minutes)"
- Visualization: Gauge
- Position: Top row, sixth position (h: 6, w: 4, x: 20, y: 0)
Query Configuration (Query A - Tickets):
URL:
https://your-company.halopsa.com/api/TicketsRoot Selector:
ticketsColumns:
id→ticket_id(number)dateoccurred→opened_time(timestamp)
Query Parameters:
datesearch:dateoccurredstartdate:${__from:date:YYYY-MM-DD} 08:00:00enddate:${__from:date:YYYY-MM-DD} 17:00:00count:1000tickettype_id:1,3
Note: Update the times here for your hours of operation
Add Second Query (Query B - Actions):
- URL:
https://your-company.halopsa.com/api/Actions - Root Selector:
actions - Columns:
ticket_id→ticket_id(number)datetime→action_time(timestamp)outcome→outcome(string)who_agentid→agent_id(number)
- Query Parameters:
startdate:${__from:date:YYYY-MM-DD} 00:00:00enddate:${__from:date:YYYY-MM-DD} 23:59:59agentonly:truecount:1000
- URL:
Transformations (in order):
- Join by field:
ticket_id, mode:outer - Filter by value: Include
opened_time Ais not null - Filter by value: Include
action_time Bis not null - Sort by:
action_time B - Group by: Group by
ticket_id, aggregateaction_time Bandopened_time AwithfirstNotNull - Calculate field:
response_time_ms=action_time B (firstNotNull)-opened_time A (firstNotNull) - Calculate field:
response_time_minutes=response_time_ms/60000 - Filter by value: Include
response_time_minutes> 0 - Organize: Exclude unnecessary fields, keep only
response_time_minutes - Reduce: Mean
- Join by field:
Field Options:
- Min: 0, Max: 90
- Thresholds: Green: 0, Green: 0, Yellow: 30, Red: 60.0001
Panel 7: Agent Utilization (Today) (Bar Gauge)
Basic Configuration:
- Panel Title: "Agent Utilization (Today)"
- Visualization: Bar gauge
- Position: Second row, full width (h: 11, w: 24, x: 0, y: 6)
Query Configuration (Query A - Agent):
- URL:
https://your-company.halopsa.com/api/Agent - Columns:
id→agent_id(number)name→name(string)
- Query Parameters:
includeenabled:truebasic_fields_only:falsecount:1000
- URL:
Add Additional Queries (B and C for timesheet data):
- Follow similar pattern with TimesheetEvent and Timesheet endpoints
- Complex transformations required (refer to JSON for exact specifications)
Display Options:
- Display mode: LCD
- Orientation: Horizontal
- Unit: Percent
- Min: 0, Max: 100
- Thresholds: Red: 0, Yellow: 30, Green: 50, Blue: 100
Panel 8: Clients by Ticket Count Today (Top 5) (Bar Chart)
Basic Configuration:
- Panel Title: "Clients by Ticket Count Today (Top 5)"
- Visualization: Bar chart
- Position: Bottom row, full width (h: 12, w: 24, x: 0, y: 17)
Query Configuration:
- URL:
https://your-company.halopsa.com/api/Tickets - Root Selector:
$.tickets.{"client_name": client_name, "ticket_count": 1} - Query Parameters:
datesearch:dateoccurredstartdate:${__from:date:YYYY-MM-DD} 00:00:00enddate:${__to:date:YYYY-MM-DD} 23:59:59count:1000requesttype_id:1,3
- URL:
Transformations:
- Group by: Group by
client_name, aggregateticket_countwith sum - Sort by:
ticket_count (sum)descending - Limit: 5
- Group by: Group by
Display Options:
- Orientation: Vertical
- X Field:
client_name - Show values: Always
Dashboard Settings
- Time Range: Current day (
now/dtonow/d) - Refresh: 30 seconds
- Timezone: Browser
Alternative: Import JSON Dashboard
If you prefer to skip the manual setup above, you can import the pre-configured dashboard:
Download the Dashboard JSON
Download agentdashboard.json from the live repository.
Import the Dashboard:
- Navigate to + > Import in Grafana
- Click Upload JSON file and select the downloaded
agentdashboard.json - OR copy the contents from the GitHub link above and paste into the text area
- Click Load
Configure Import Settings:
- Name: Agent Dashboard (or customize as needed)
- Folder: Select appropriate folder
- Data Source: Select your Infinity data source from the dropdown
- Click Import
Update API URLs:
- After importing, edit each panel to update the API URLs
- Replace
https://COMPANY.halopsa.com/api/with your actual HaloPSA API URL - Verify all query parameters match your API requirements
API Requirements
This dashboard expects the following API endpoints to be available:
- GET /api/Tickets - Ticket data with filtering capabilities
- GET /api/Agent - Agent information
- GET /api/TimesheetEvent - Time tracking data
- GET /api/Timesheet - Timesheet configuration
Required Query Parameters
The dashboard uses these common parameters:
datesearch- Field to filter by datestartdate/enddate- Date range filtersincludeclosed- Include/exclude closed ticketstickettype_id/requesttype_id- Filter by ticket typescount- Limit number of results
Troubleshooting
Common Issues
No Data Displayed
- Verify data source configuration and connectivity
- Check API endpoint URLs and authentication
- Ensure query parameters match your API requirements
Panels Showing Errors
- Update the data source UID in all panel configurations
- Verify JSON syntax if manually editing queries
- Check API response format matches expected structure
Incorrect Data
- Review root_selector JSONata expressions
- Adjust date format parameters to match your API
- Verify field names in transformations
Customization
Adding New Panels
- Click Add panel in edit mode
- Configure the Infinity data source
- Set up your API query with appropriate parameters
- Use JSONata expressions for data transformation
- Configure visualization type and styling
Modifying Existing Panels
- Enter edit mode for the panel
- Adjust queries, transformations, or visualizations as needed
- Test changes before saving
Support
For issues specific to:
- Grafana Configuration: Refer to Grafana documentation
- Infinity Plugin: Check the plugin documentation on GitHub
- API Integration: Consult your ticketing system's API documentation
Note: Remember to replace all placeholder URLs and UIDs with your actual configuration values before using the dashboard.
Source
This documentation is based on the Agent Dashboard from the HaloPSA repository.